
Solar Atlas: A Solar Dashboard on a Multi-Environment AWS Platform
How we built Solar Atlas, a live dashboard and peak-hour scheduler for hybrid solar inverters, on AWS with Terraform and pull-request deployments.
- Type
- Our own product
- Built by
- Infra8, in-house
- Runs on
- Amazon Web Services
- Area
- Energy monitoring and automation
- Stack
Why We Built It
Short answer
Solar Atlas is our own product: a live dashboard and peak-hour scheduler for hybrid solar inverters. It started as a tool for one home installation and became our reference AWS platform, with separate dev and production environments defined in Terraform, every change planned on a pull request, and an architecture that keeps running costs low.
Hybrid inverter apps show what is happening now, but keep little history and have no time-of-use automation. Making the most of cheaper off-peak power meant switching the inverter's mode by hand at every peak boundary, every day.
The engineering problem came next. The first version lived in a single production-only setup, so every change touched production and nothing could be rehearsed first.
What Solar Atlas Does
- 01
Live energy flow
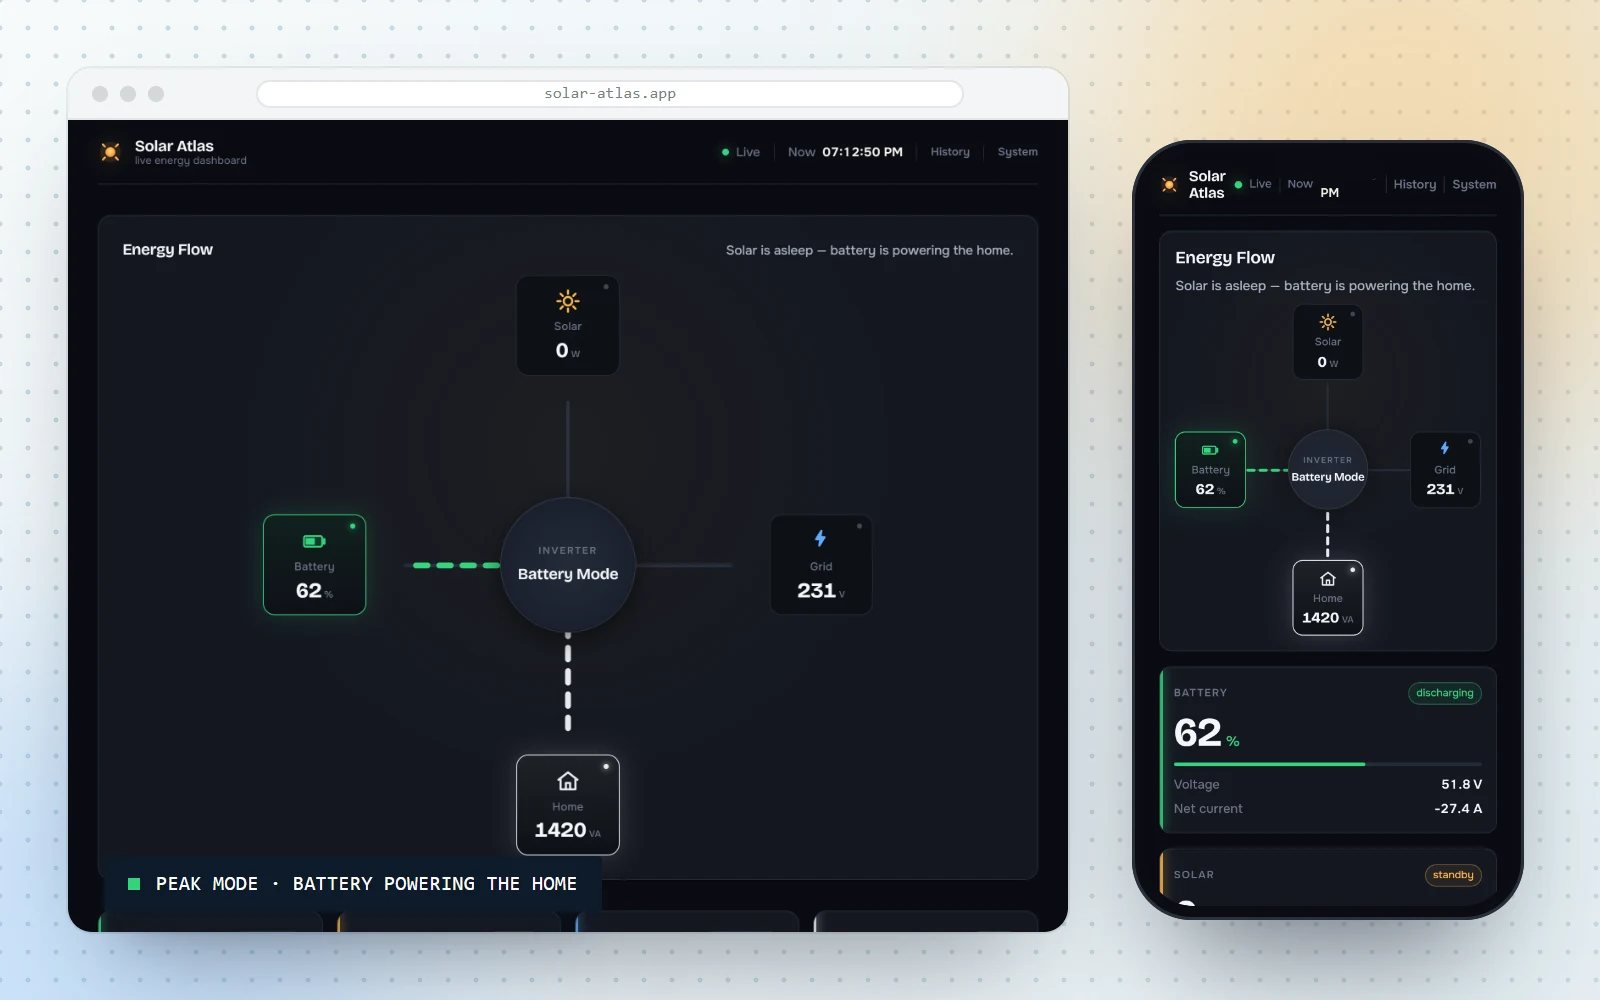
Solar, battery, grid and home in one animated diagram, with the readings that matter beside it.
- 02
History that stays
A reading is stored every five minutes, so any past day can be charted.
- 03
Peak-hour scheduler
Set the peak window once. Solar Atlas switches modes at each boundary, even with the dashboard closed.
- 04
Three inverter modes
Default, Peak hour and Off-peak hour, applied on schedule or by hand.
- 05
Installable web app
Works in any browser and installs to a phone's home screen like an app.
The System, Step by Step
A high-level view of how the pieces fit together.
- 01 · SourceInverter cloudSolar Atlas uses the inverter's existing cloud account to read data and change modes.
- 02 · ServiceBackend and schedulerA small containerised service on AWS serves live data and switches modes on time.
- 03 · CollectScheduled readingsA serverless function stores a reading every five minutes.
- 04 · StoreHistory databaseReadings are kept in a managed, pay-per-use database.
- 05 · ShowDashboardAn installable web app delivered through a global CDN.
- 01 · ProposePull requestEvery infrastructure change starts as a pull request, with the Terraform plan posted for review.
- 02 · CheckAutomated checksFormatting, linting, security and secret scans run before anything merges.
- 03 · ApplyDev on mergeMerging applies the change to the dev environment first.
- 04 · PromoteProduction on purposeProduction is updated in a separate, deliberate step.
The Choices That Shaped It
- 01
One set of modules, separate environments
Dev and production are built from the same Terraform modules, each with its own settings and state, so a change can be rehearsed before it reaches production.
- 02
No stored cloud keys
The pipeline signs in to AWS with short-lived credentials, so no long-lived access keys sit in CI.
- 03
Cost-first architecture
No load balancer, NAT gateway or Kubernetes where a small service does the job. Serverless functions handle collection and history.
- 04
A private origin for the web app
The dashboard's files sit in a private bucket that only the CDN can read.
Screens From the Product
Real product screens, shown with sample data.
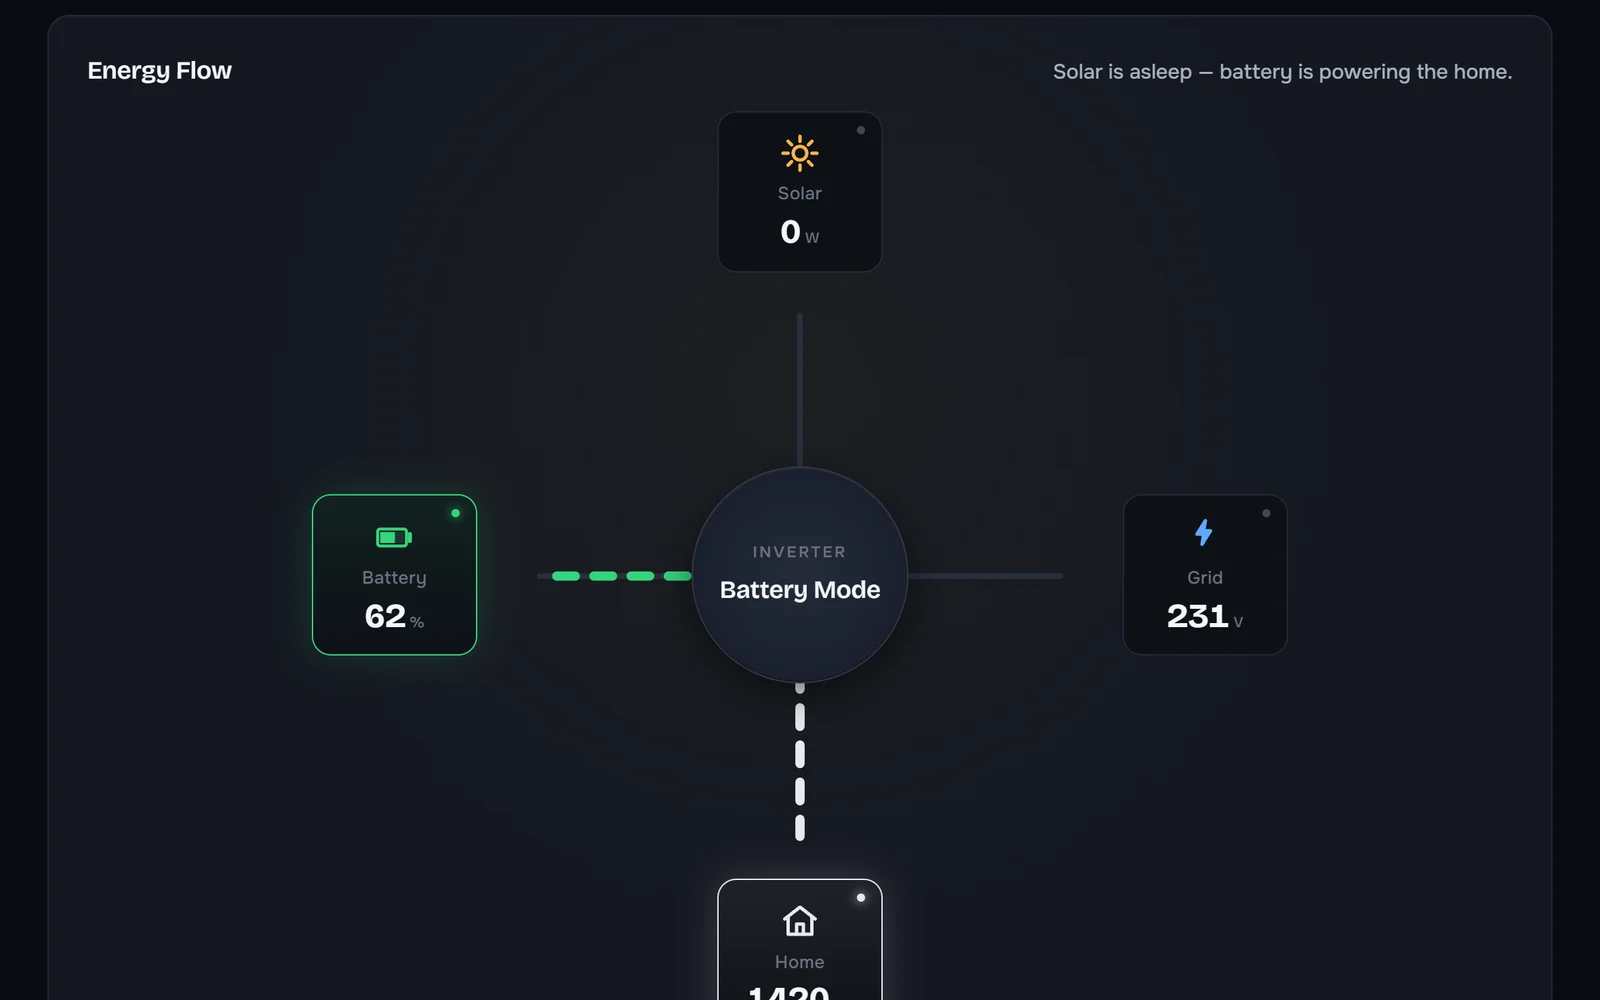
Live energy flow: the battery is powering the home 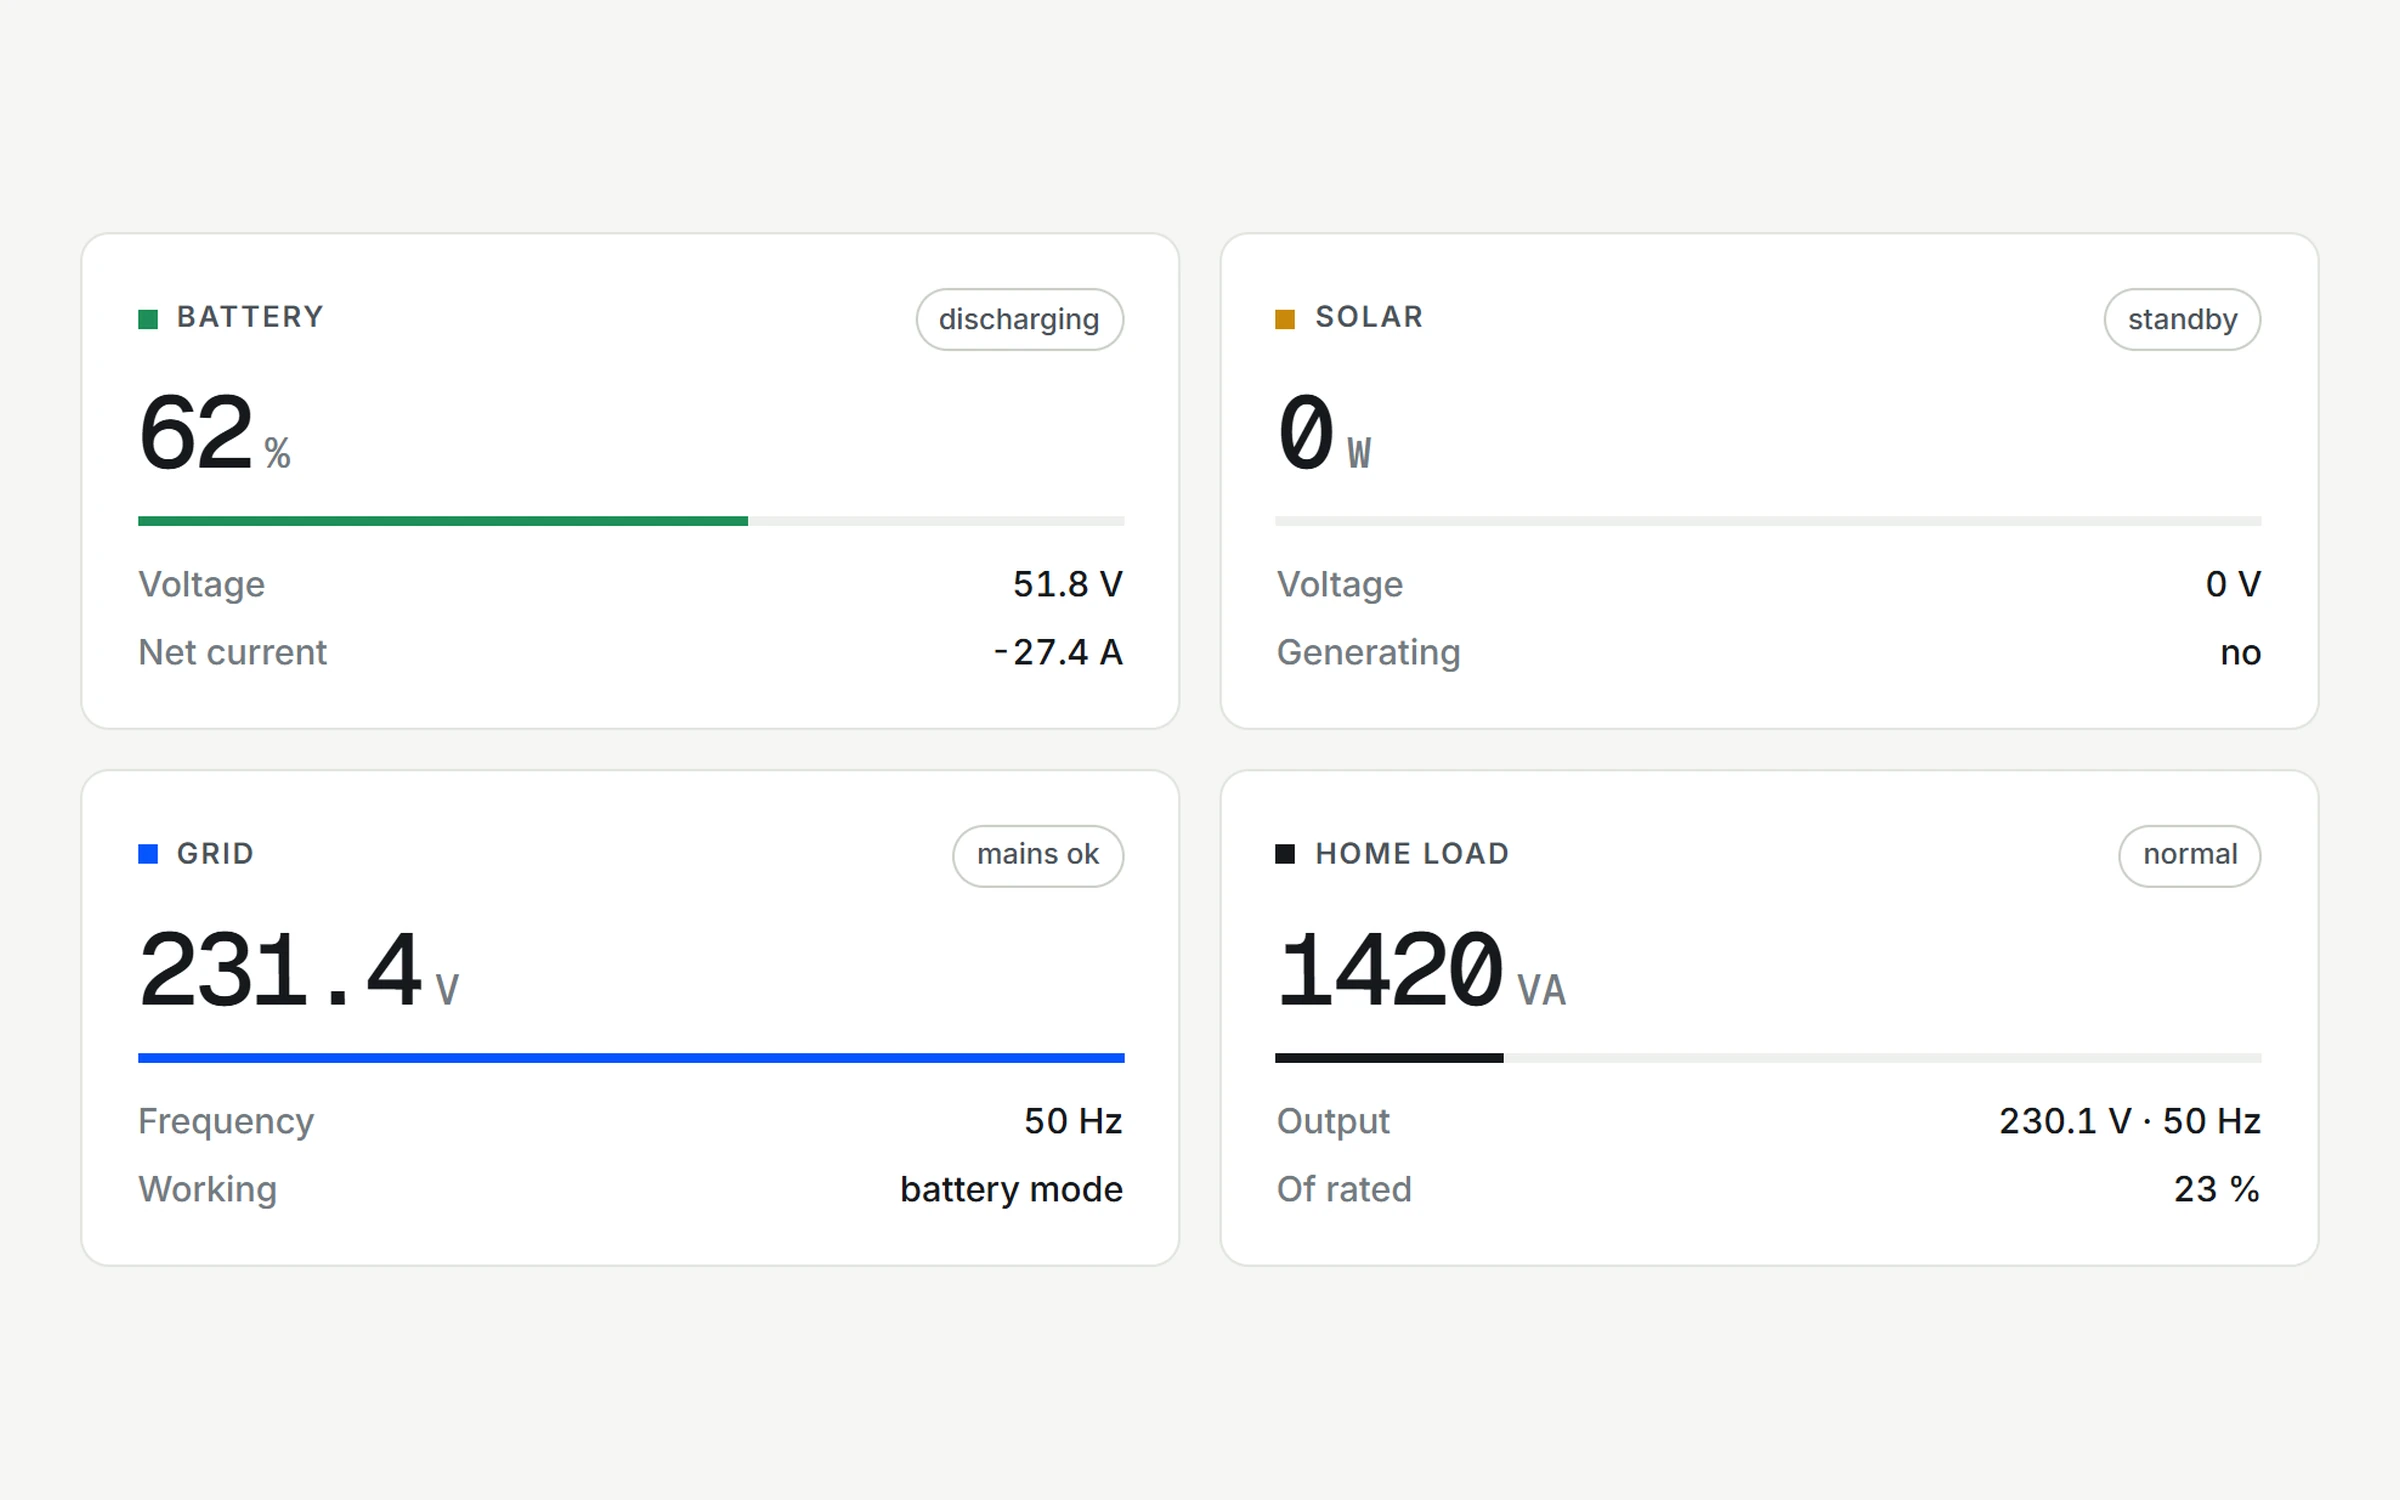
Readings for battery, solar, grid and home 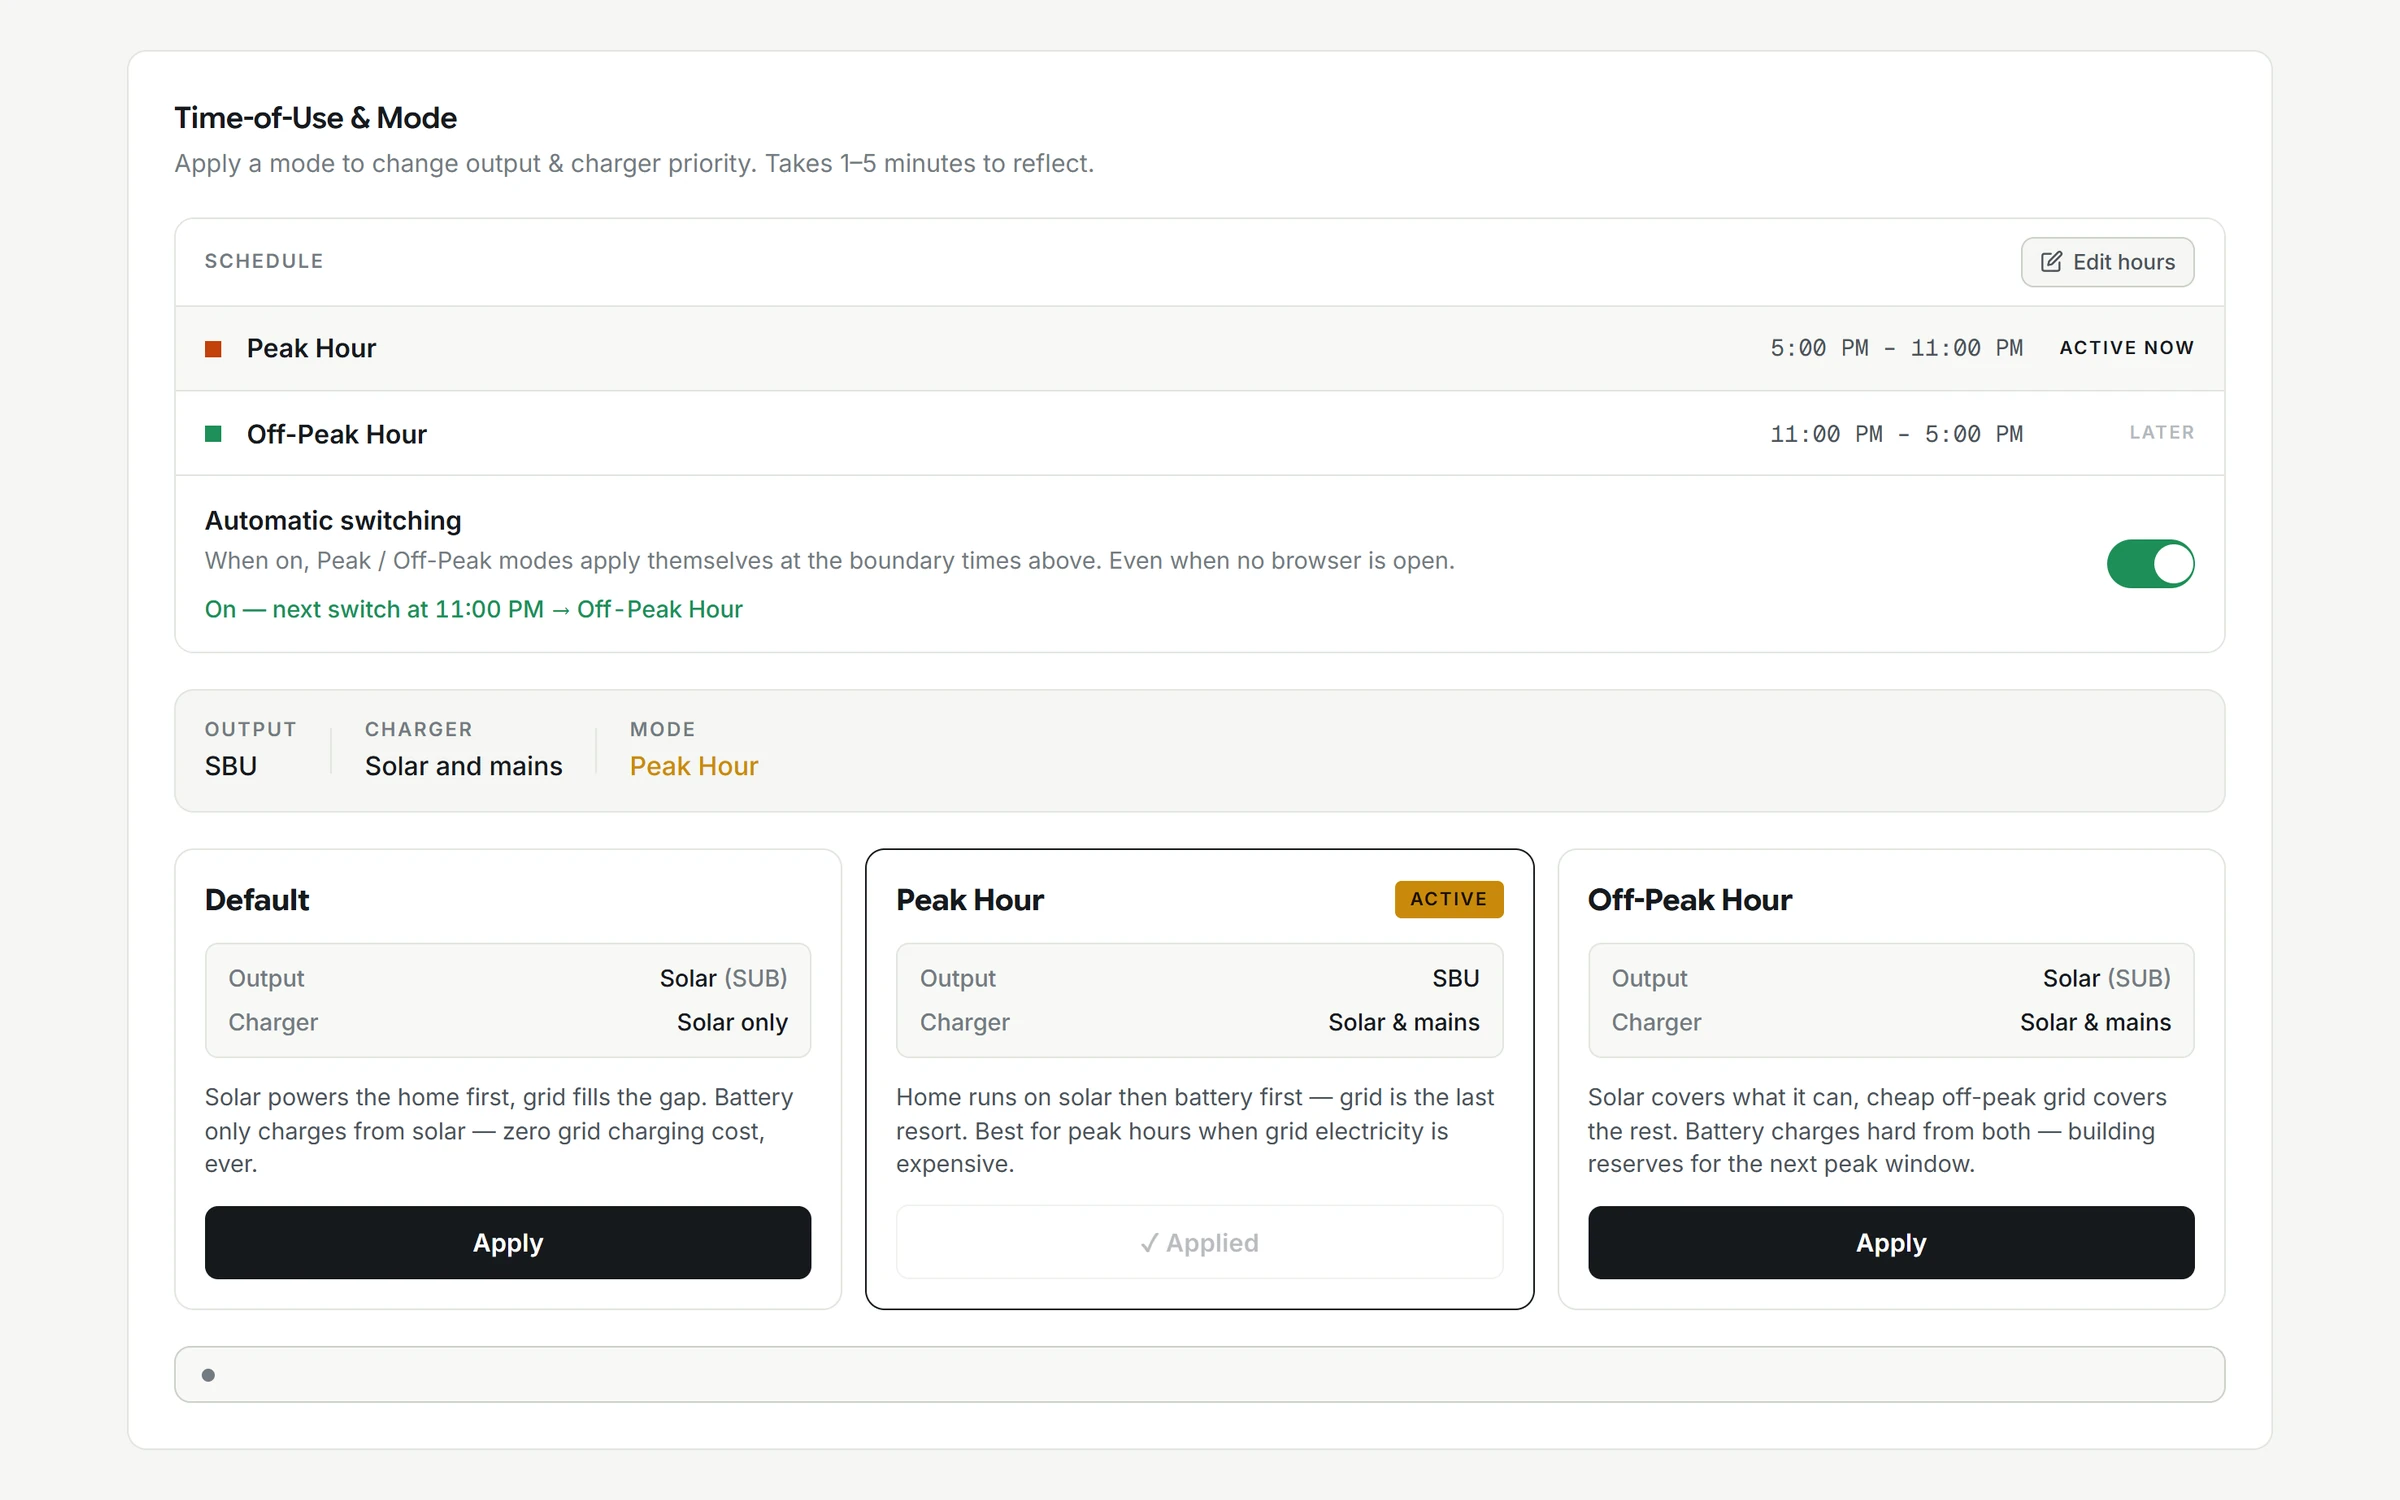
The peak-hour schedule and the three inverter modes
What This Work Demonstrates
- A dashboard that keeps the history the inverter app doesn't, and switches modes on schedule.
- A reference AWS platform: the environments, pipeline and reviews we bring to client cloud work.
- Infrastructure that is rebuilt from code, and can be torn down when it isn't needed to control cost.
Screens show the real dashboard with sample readings. Solar Atlas is independent of, and not affiliated with, SmartESS, DessMonitor or Eybond.
Related service
Cloud/DevOps management
Your cloud, CI/CD and security run for you. Starts with a free audit.
Explore ServiceMore Case Studies
Tell Us Where Your Product Is. You'll Hear Back in 24 Hours on Business Days.
- Fixed scope
- You own everything
- NDA on request